Crafting a new UX and UI foundation for a premium BioTech SaaS product
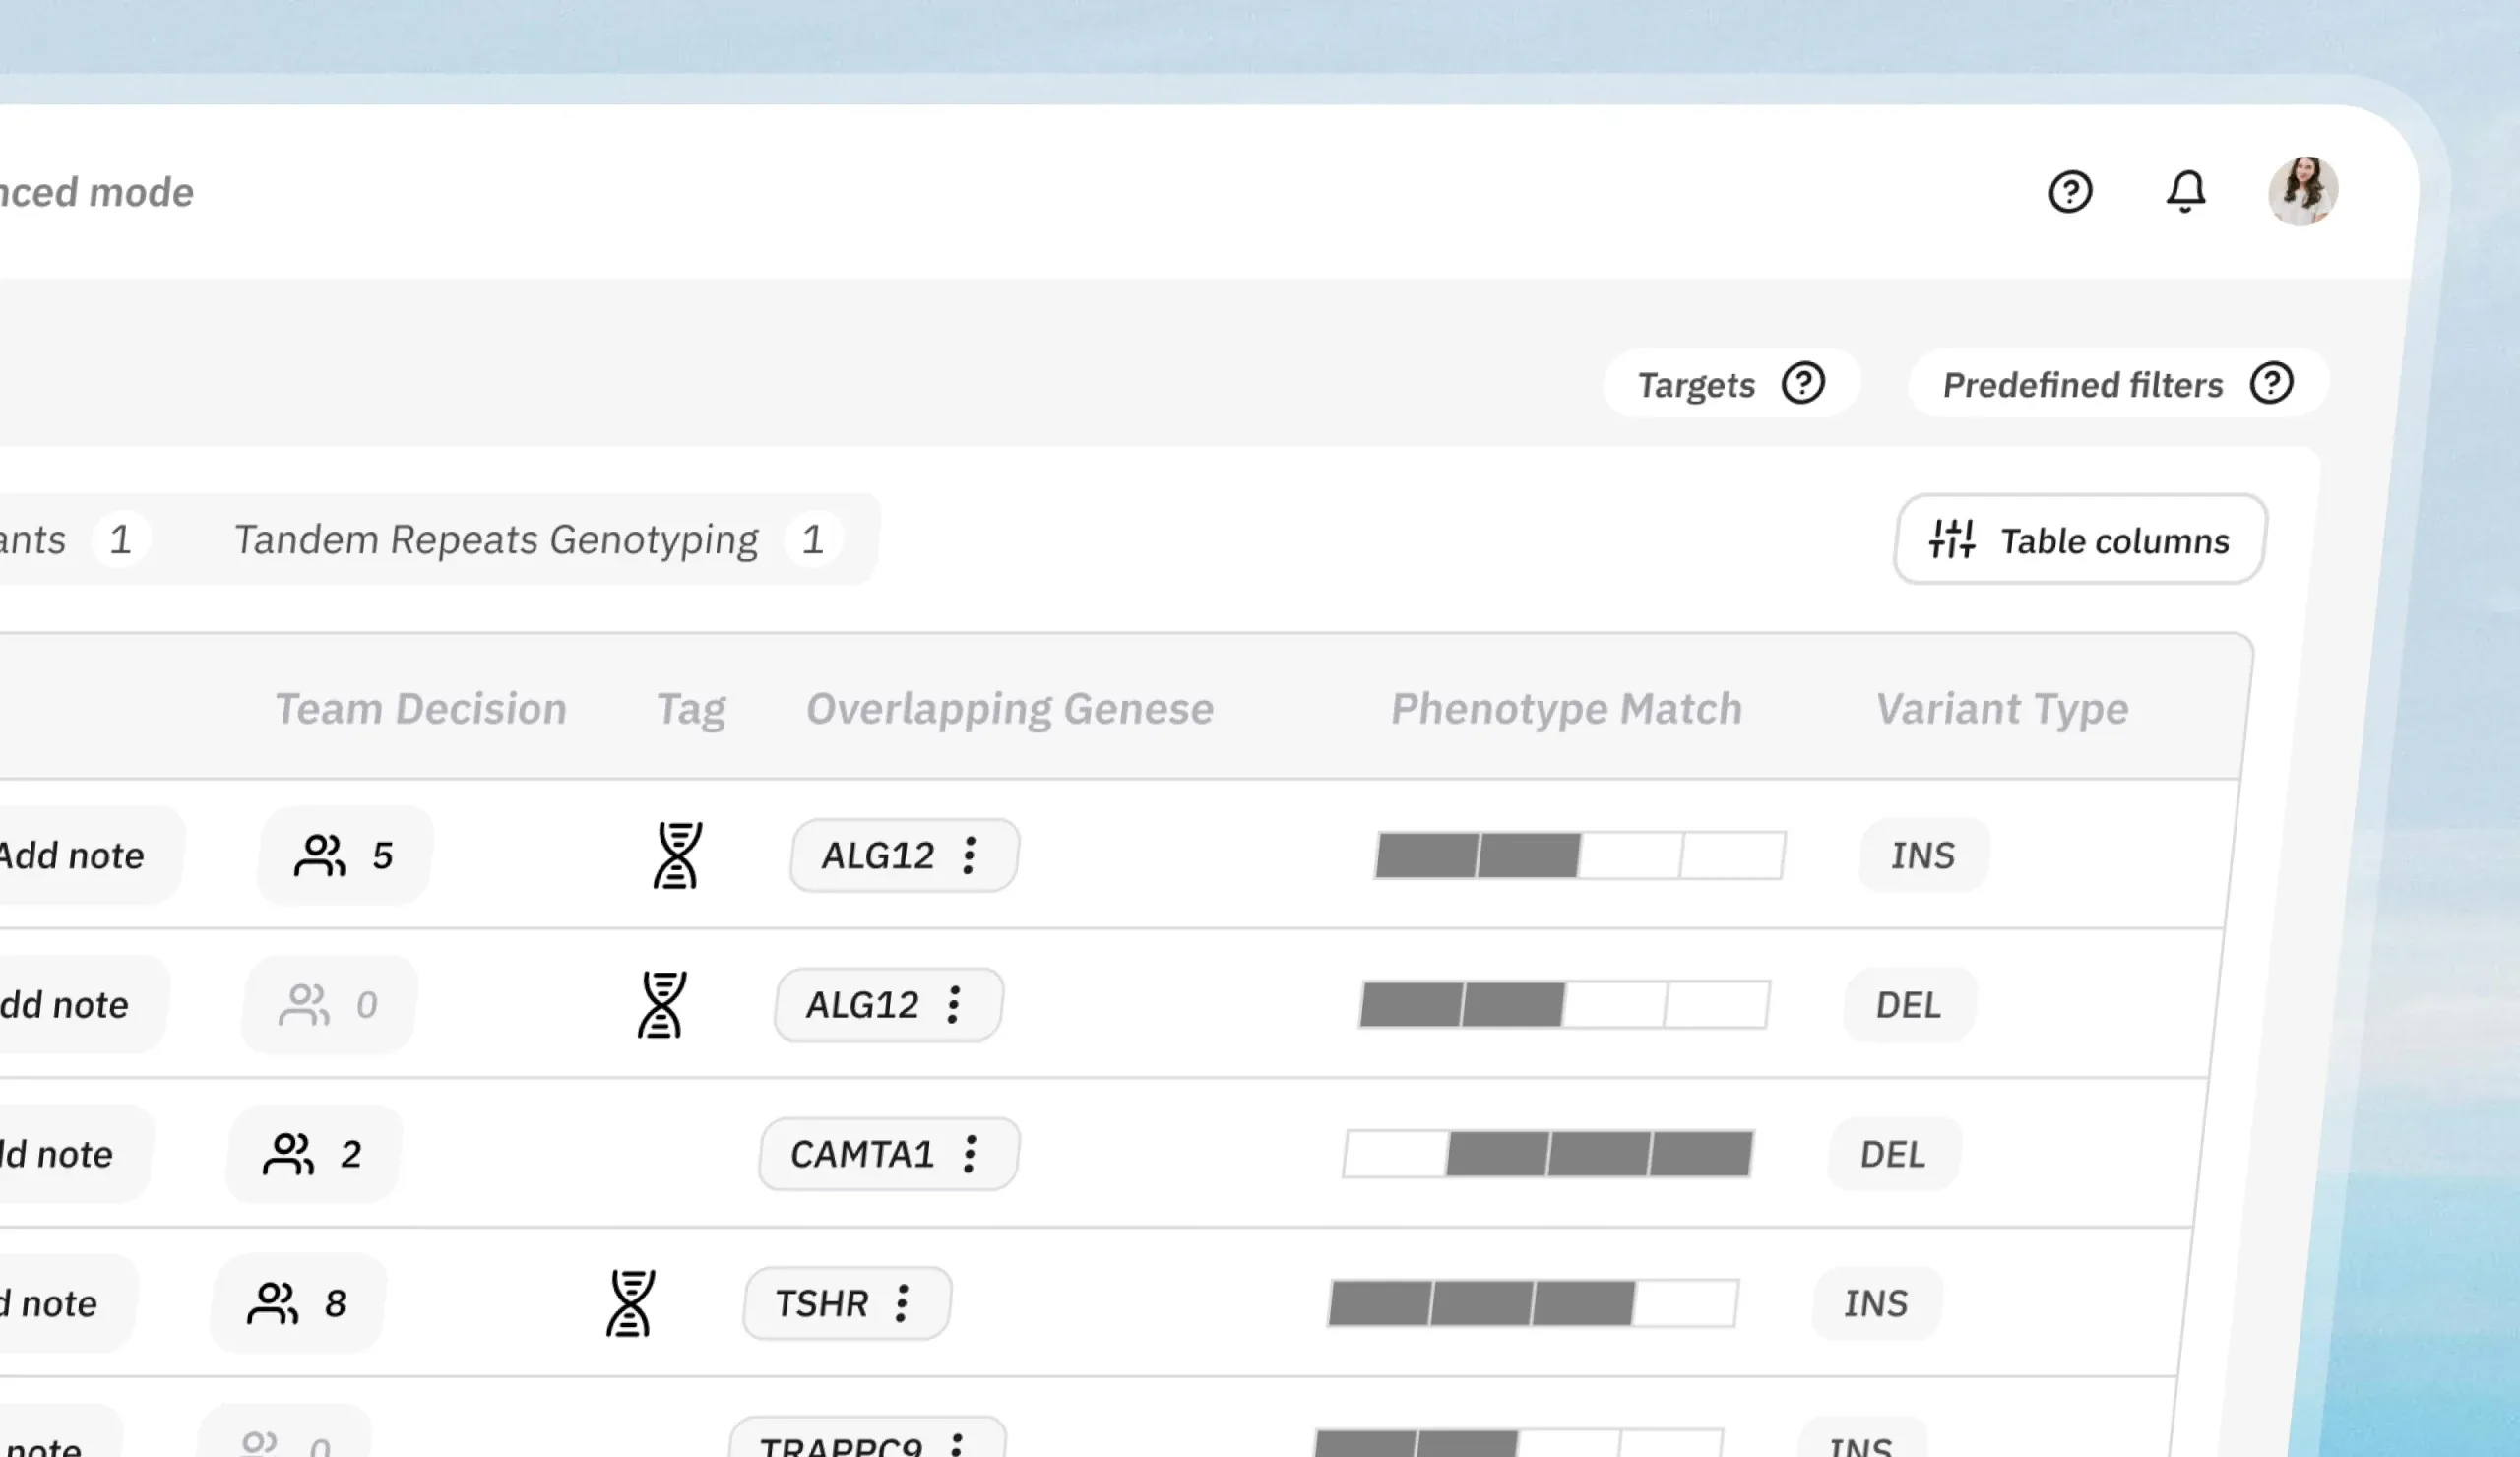
Lucid Genomics is a Berlin healthtech company building AI-driven DNA analysis. A spin-off from the Max Planck Institute for Molecular Genetics and the Charité Universitätsmedizin Berlin, its product helps healthcare and pharmaceutical teams extract genomic information, including the “dark genome”, to improve diagnostics, cancer screening, and drug discovery.
Two user types, two workflows, one feature-based product.
The product has two kinds of user, and they work nothing alike. The product had been built around features, and those features had been shaped by researchers. Clinicians were then handed the same ones, plus a few of their own. Neither group's way of working was in the structure.
Researchers
The researcher works in days and months.
Clinicians
The clinician needs an answer in minutes.
Why it mattered
Lucid had a working product, but users couldn't reliably find or use the features that mattered to them. Features sat behind clicks, in no order anyone recognised, and that cost the business: onboarding stalled, new customers lost momentum, and some existing ones drifted away.
“Our product was organized around features; our users worked in flows. They proved that with real research instead of opinion, and rebuilt the structure around it. It changed what we built, not only how it looked.”

Hossein Moeinzadeh
Co Founder and CPTO at Lucid Genomics
A discovery sprint: what to fix, and what to rebuild.
Before any design work, we ran a discovery sprint with Lucid's team, from mapping the customer journey to a roadmap that split the work into quick wins and a longer-term solution.
We mapped the customer journey
We worked directly with the CEO, CPTO, COO, tech lead, customer success and product owners, so decisions were made in the room and domain questions came back in hours.
In a workshop, we mapped the journey users travel, from onboarding through active use of the product. This gave every later decision a real step in the user's process to anchor to.
We translated features into workflows
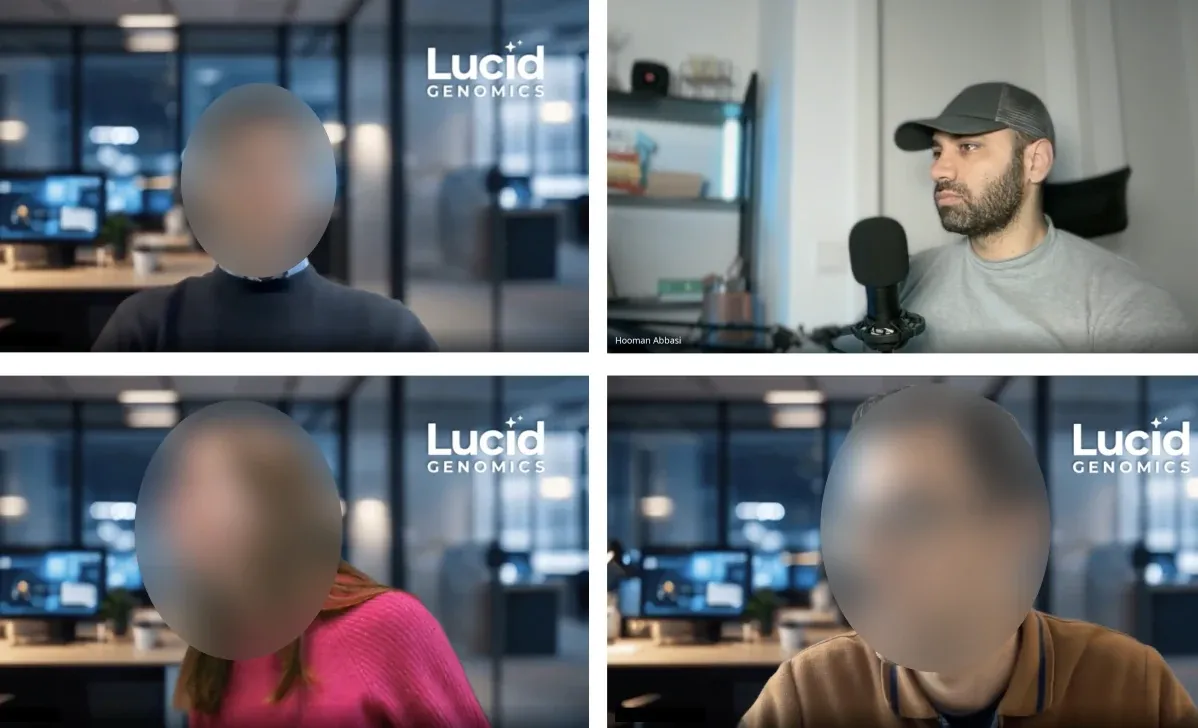
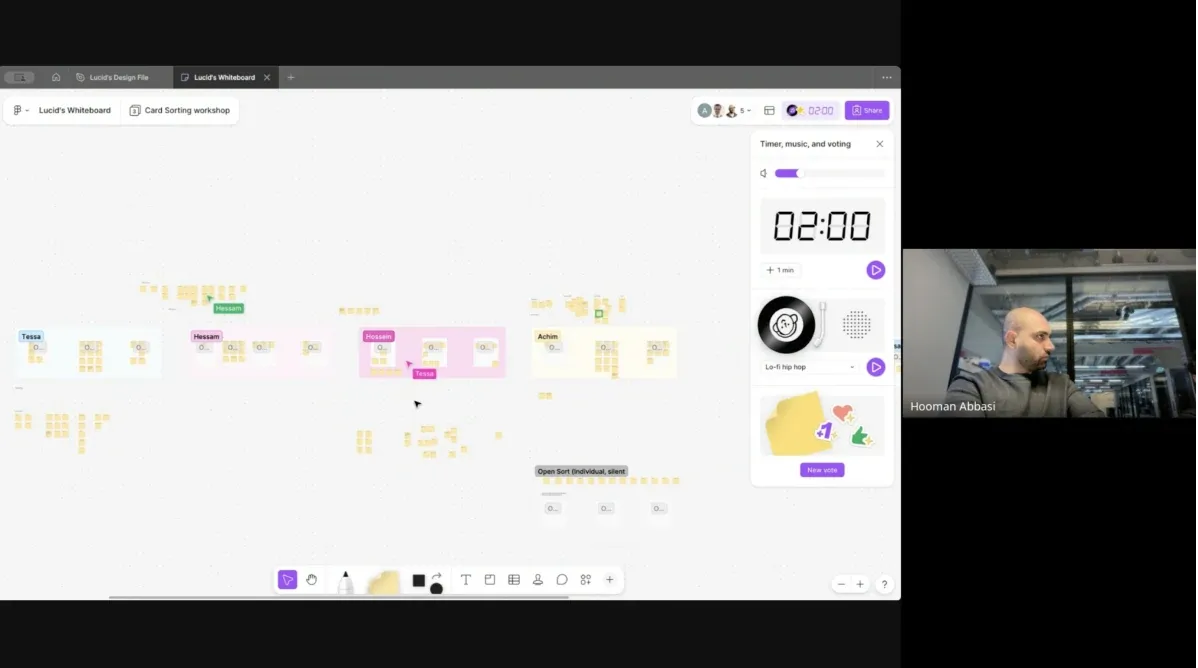
We ran a design thinking workshop with the people who knew the product and the customers best: the CPTO, COO, customer success manager, a product owner, and the tech lead. Together we turned a feature-based structure into a workflow-based one, grounded in each user type's mental model: the researcher who works in days and months, the clinician who needs an answer in minutes.
We defined the information architecture
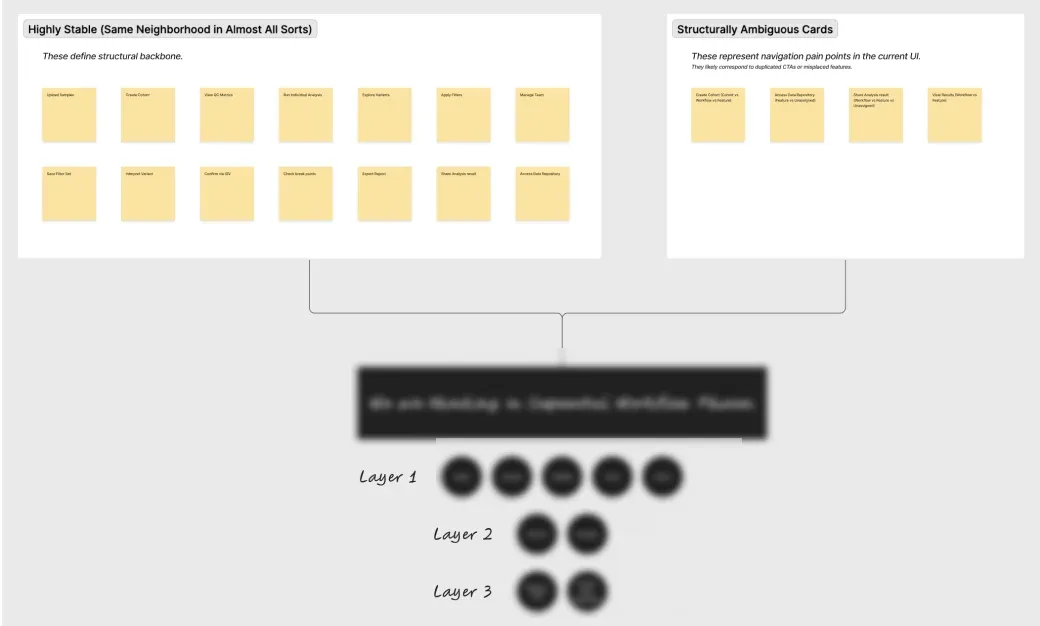
The Design Thinking workshop gave us direction. From it, we defined the product's new information architecture, built around how researchers and clinicians each work, and the structure everything that followed was designed on.
We validated assumptions with real users
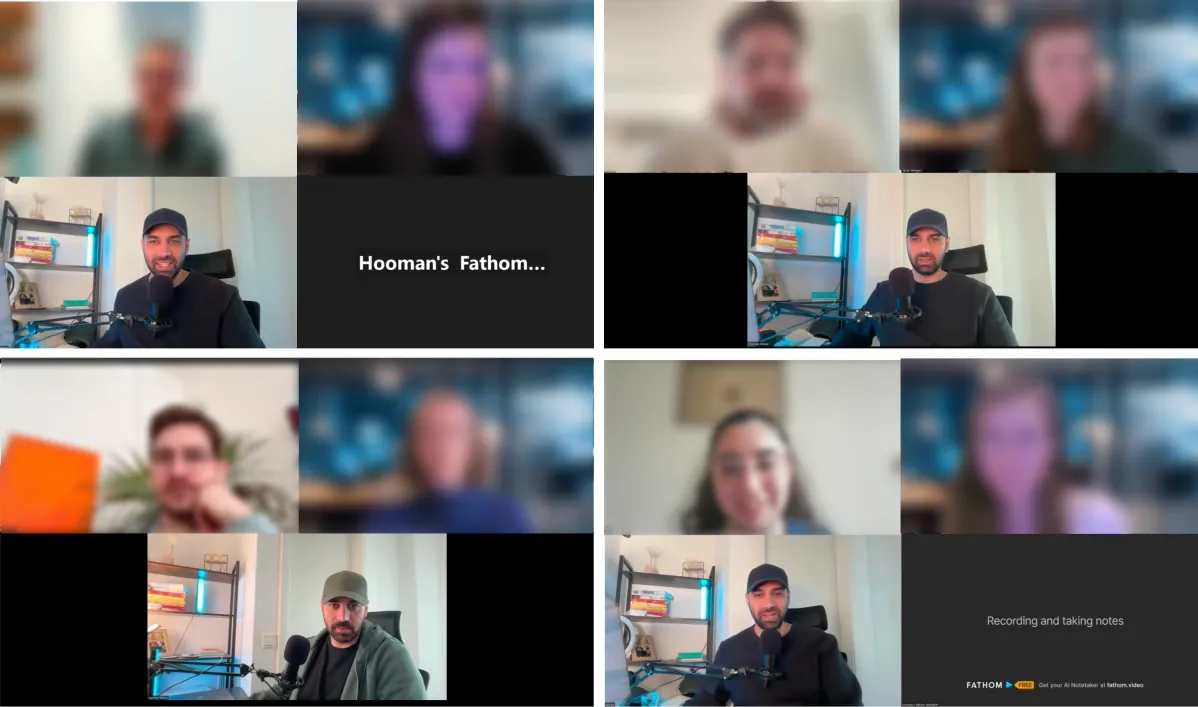
We tested the new structure against reality, running usability tests and interviews with eight users and customers, evaluating the assumptions behind the new architecture. Then we analyzed each session individually, capturing screenshots from the product and annotating them directly with the feedback, turning scattered observations into a precise, visual record of what was and wasn't working.
We turned findings into a roadmap
We turned the validated issues into a product roadmap, shaped together with the CPTO, so every improvement ahead traces back to how researchers and clinicians actually work.
“We weren't going to redesign screens. We were going to re-architect the product around how its users actually work.”

Hooman Abbasi
Design Lead of the project
Four design iterations.
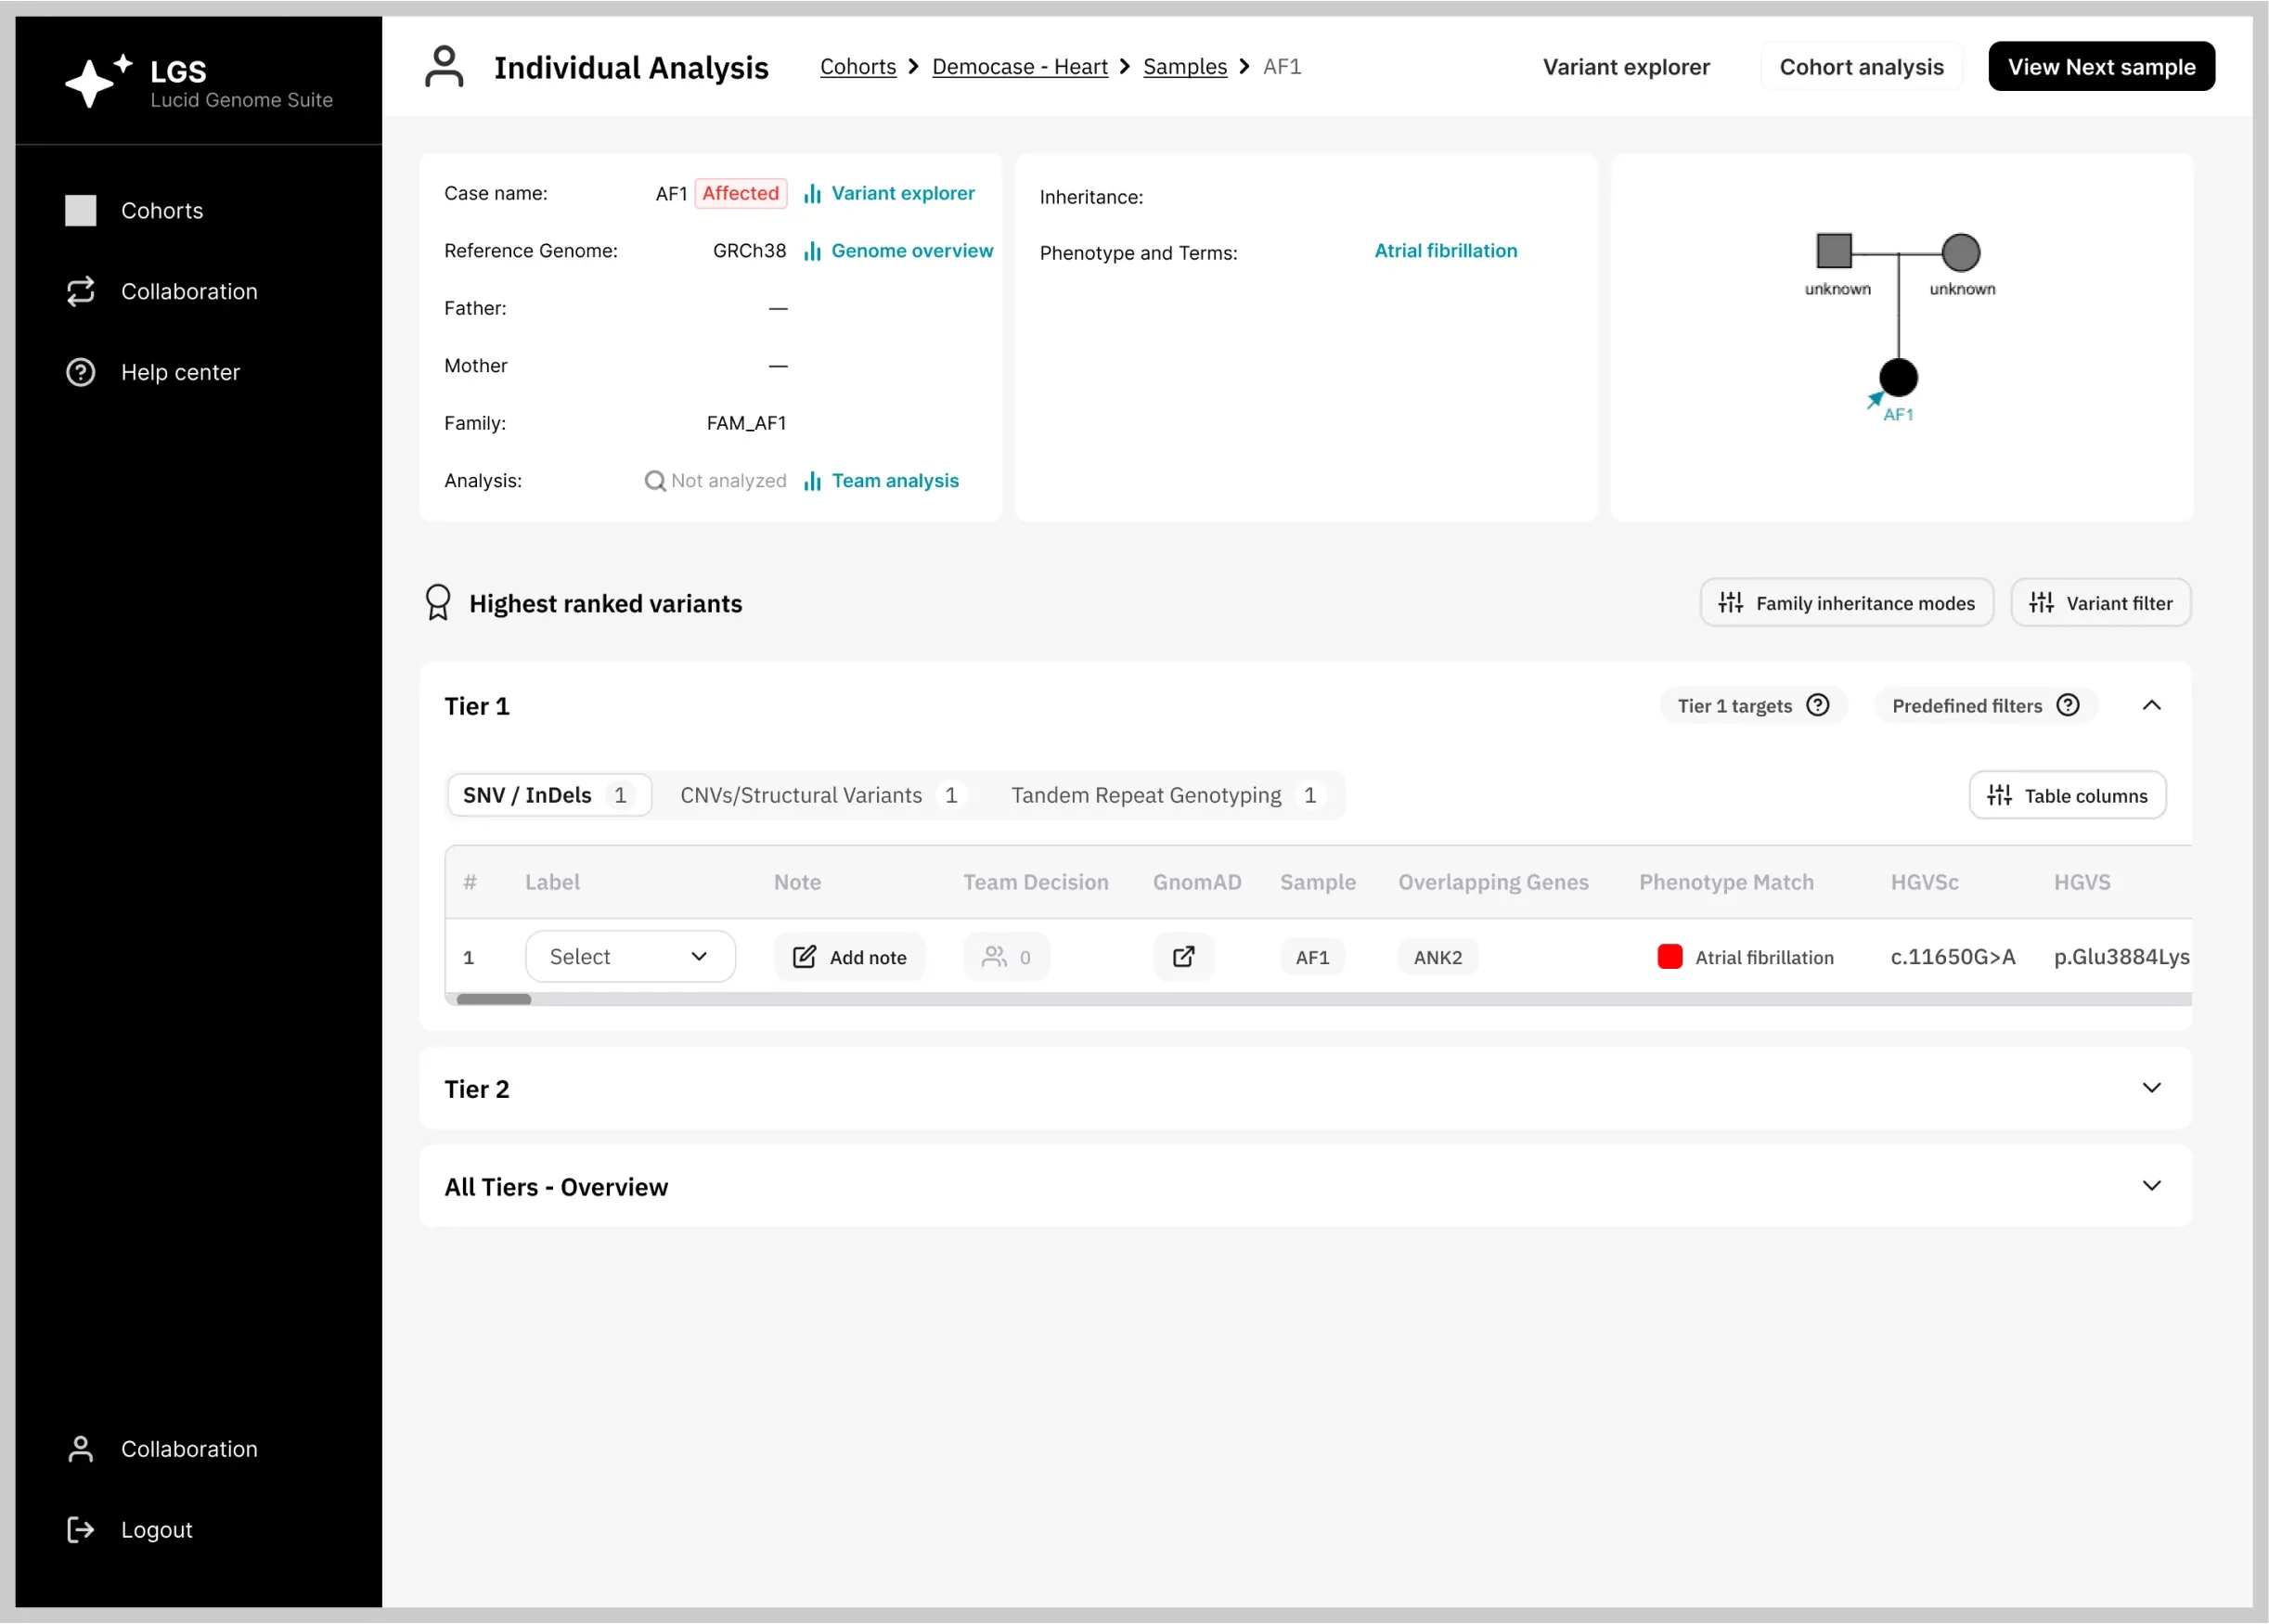
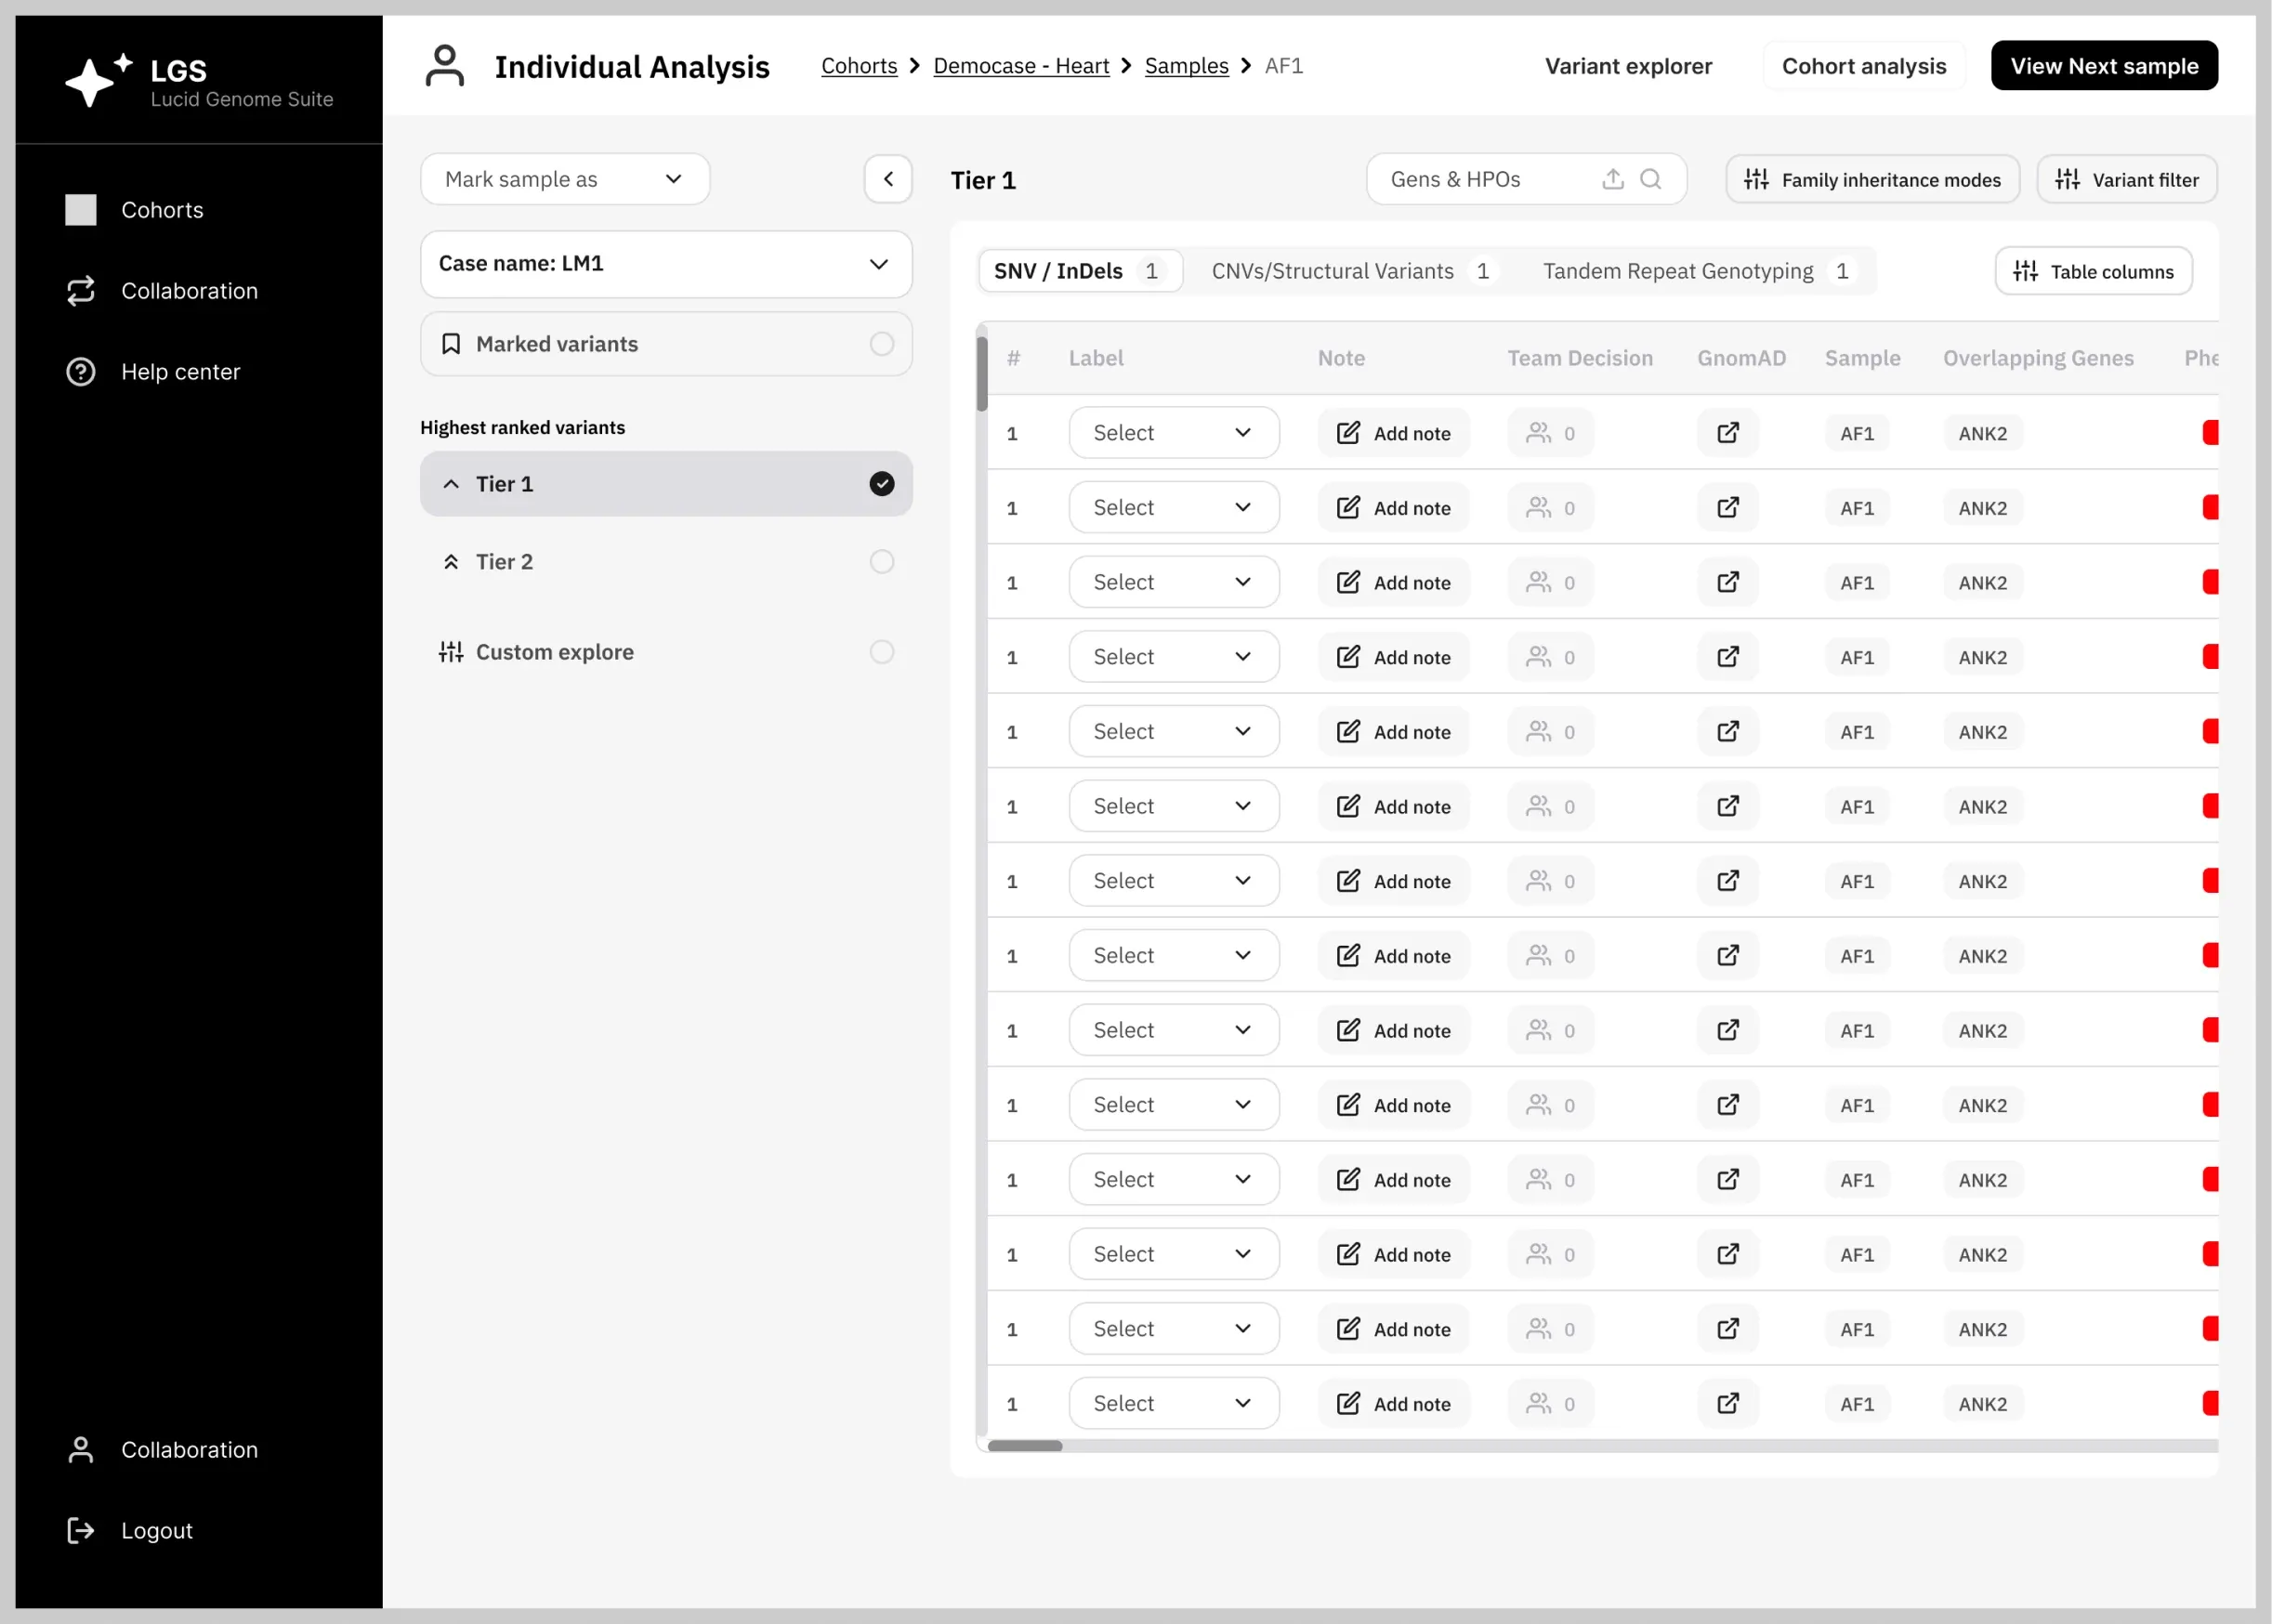
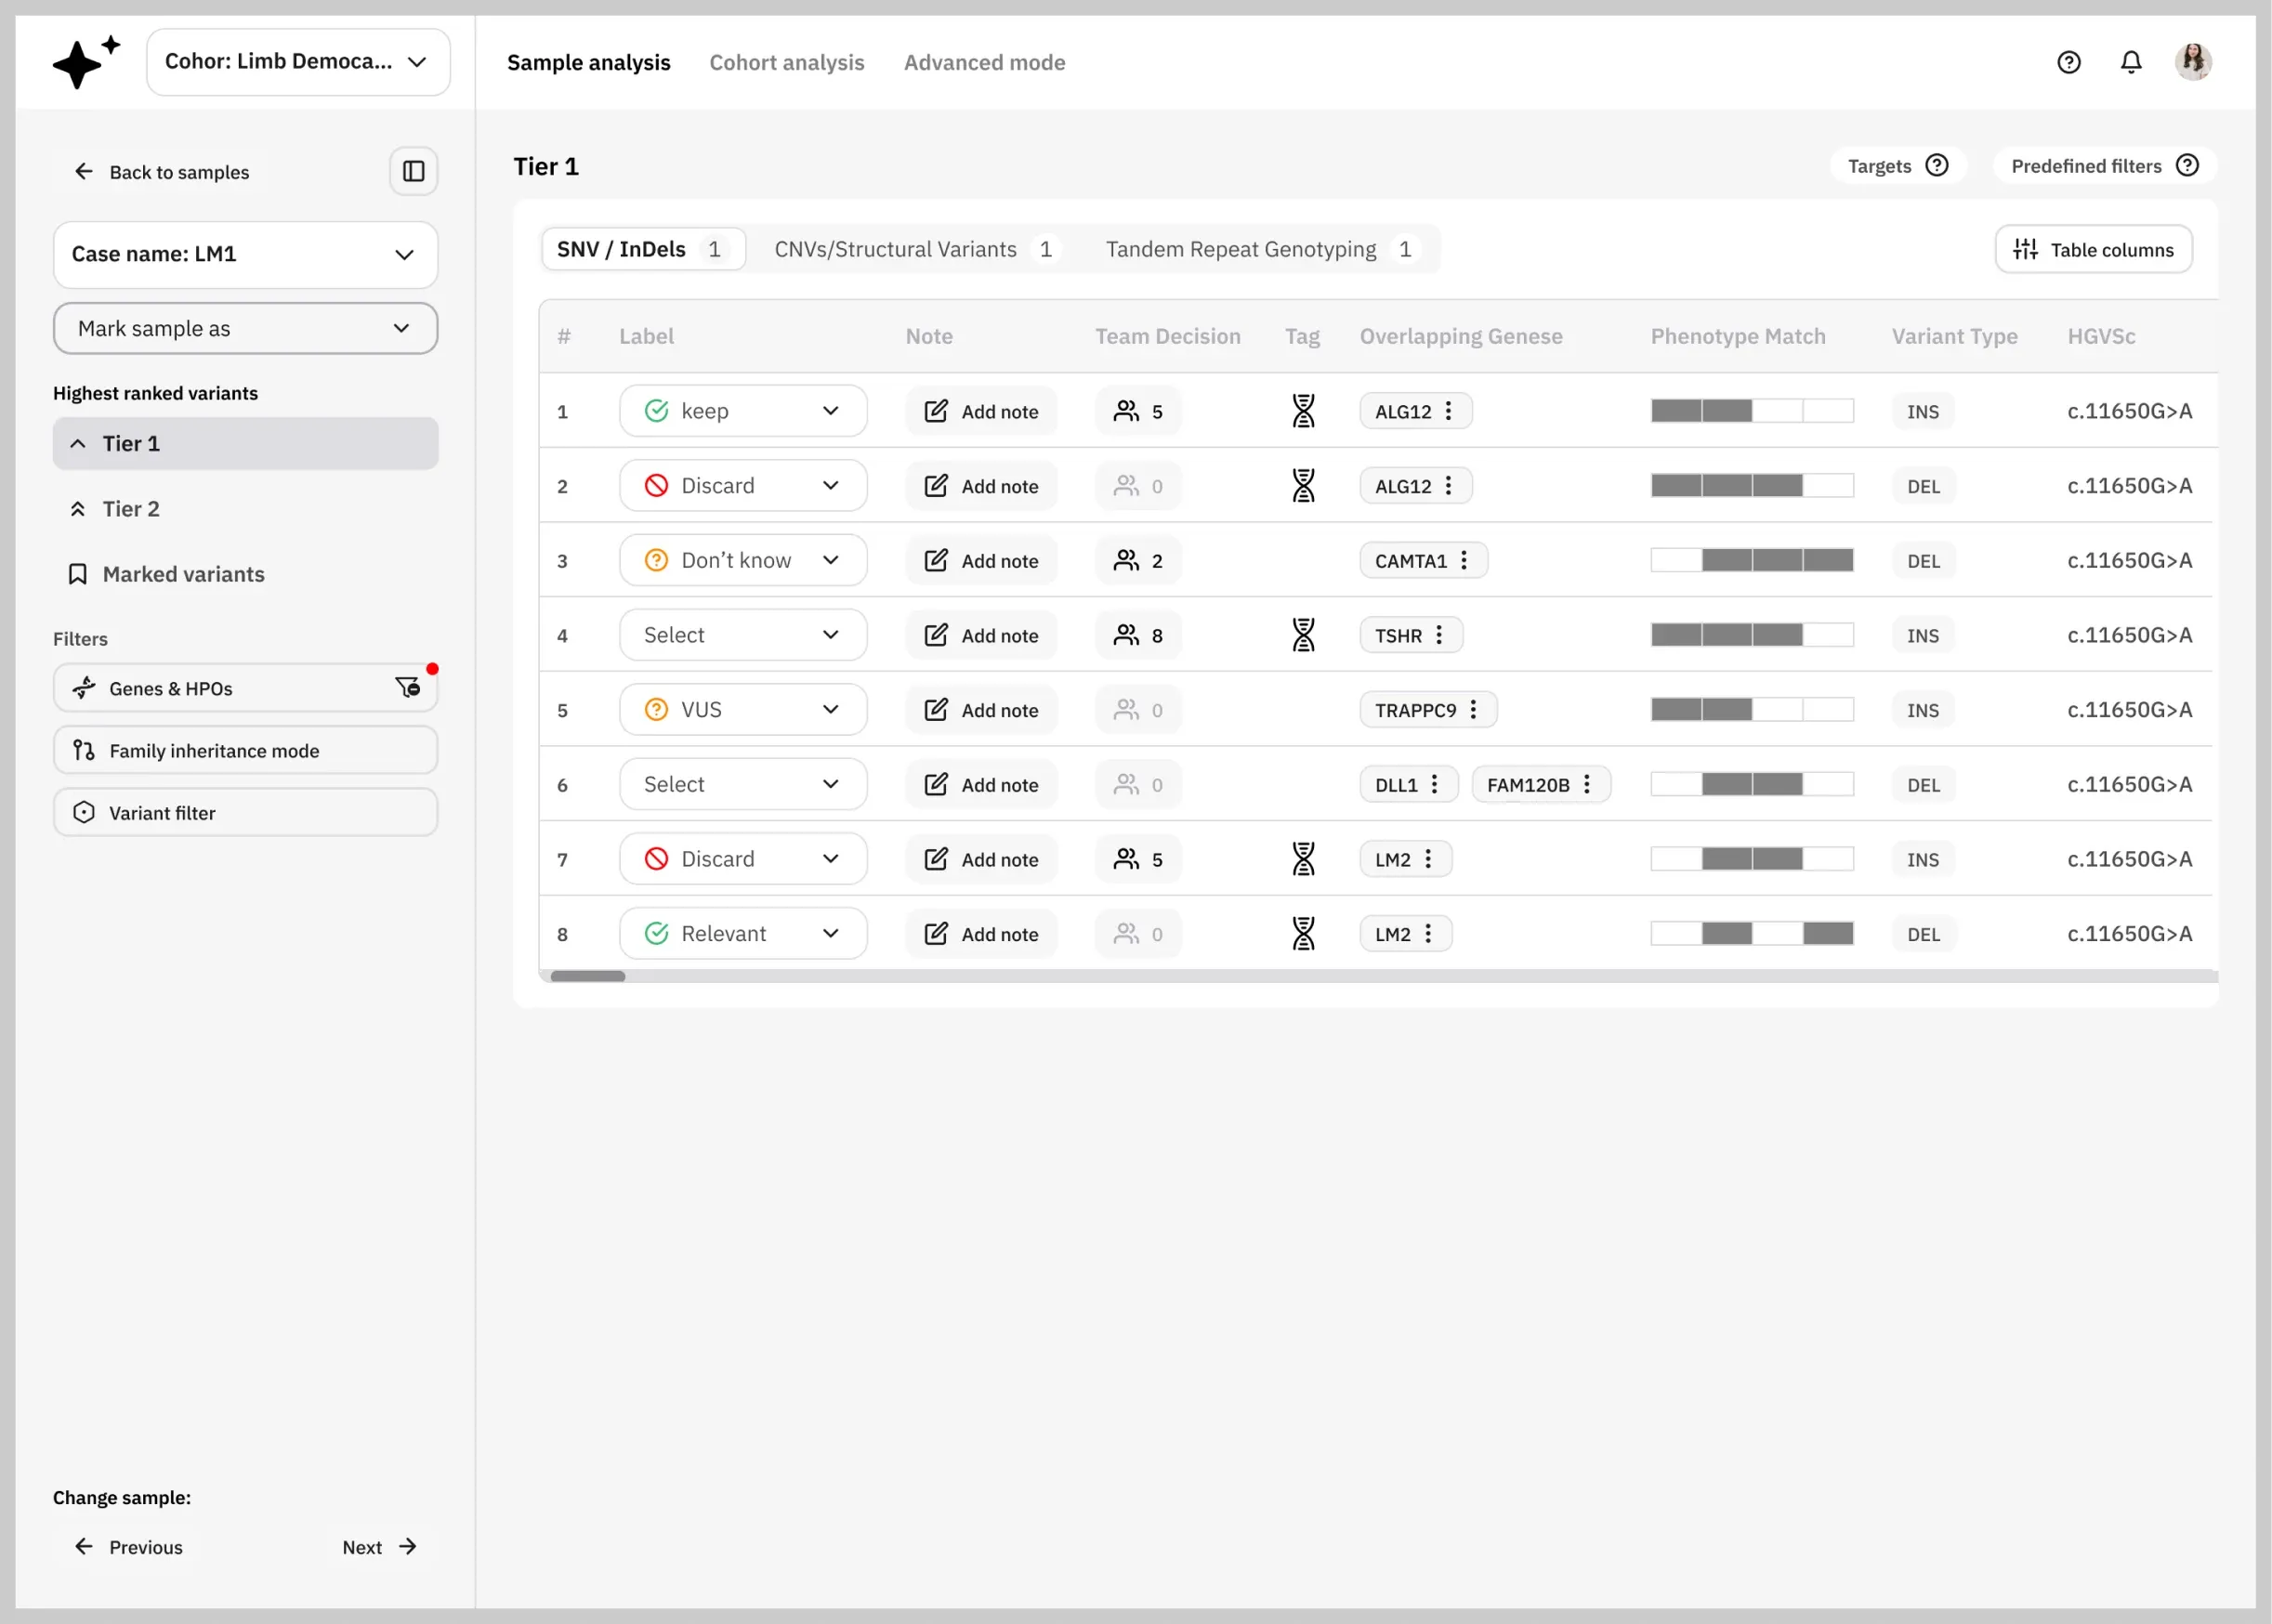
We set the target state in month one. It was too big to build at once and too far from what existing users knew, so we shipped toward it in four versions: design, test, launch, learn, improve. V4 is close to that original vision, with the changes real users asked for along the way.
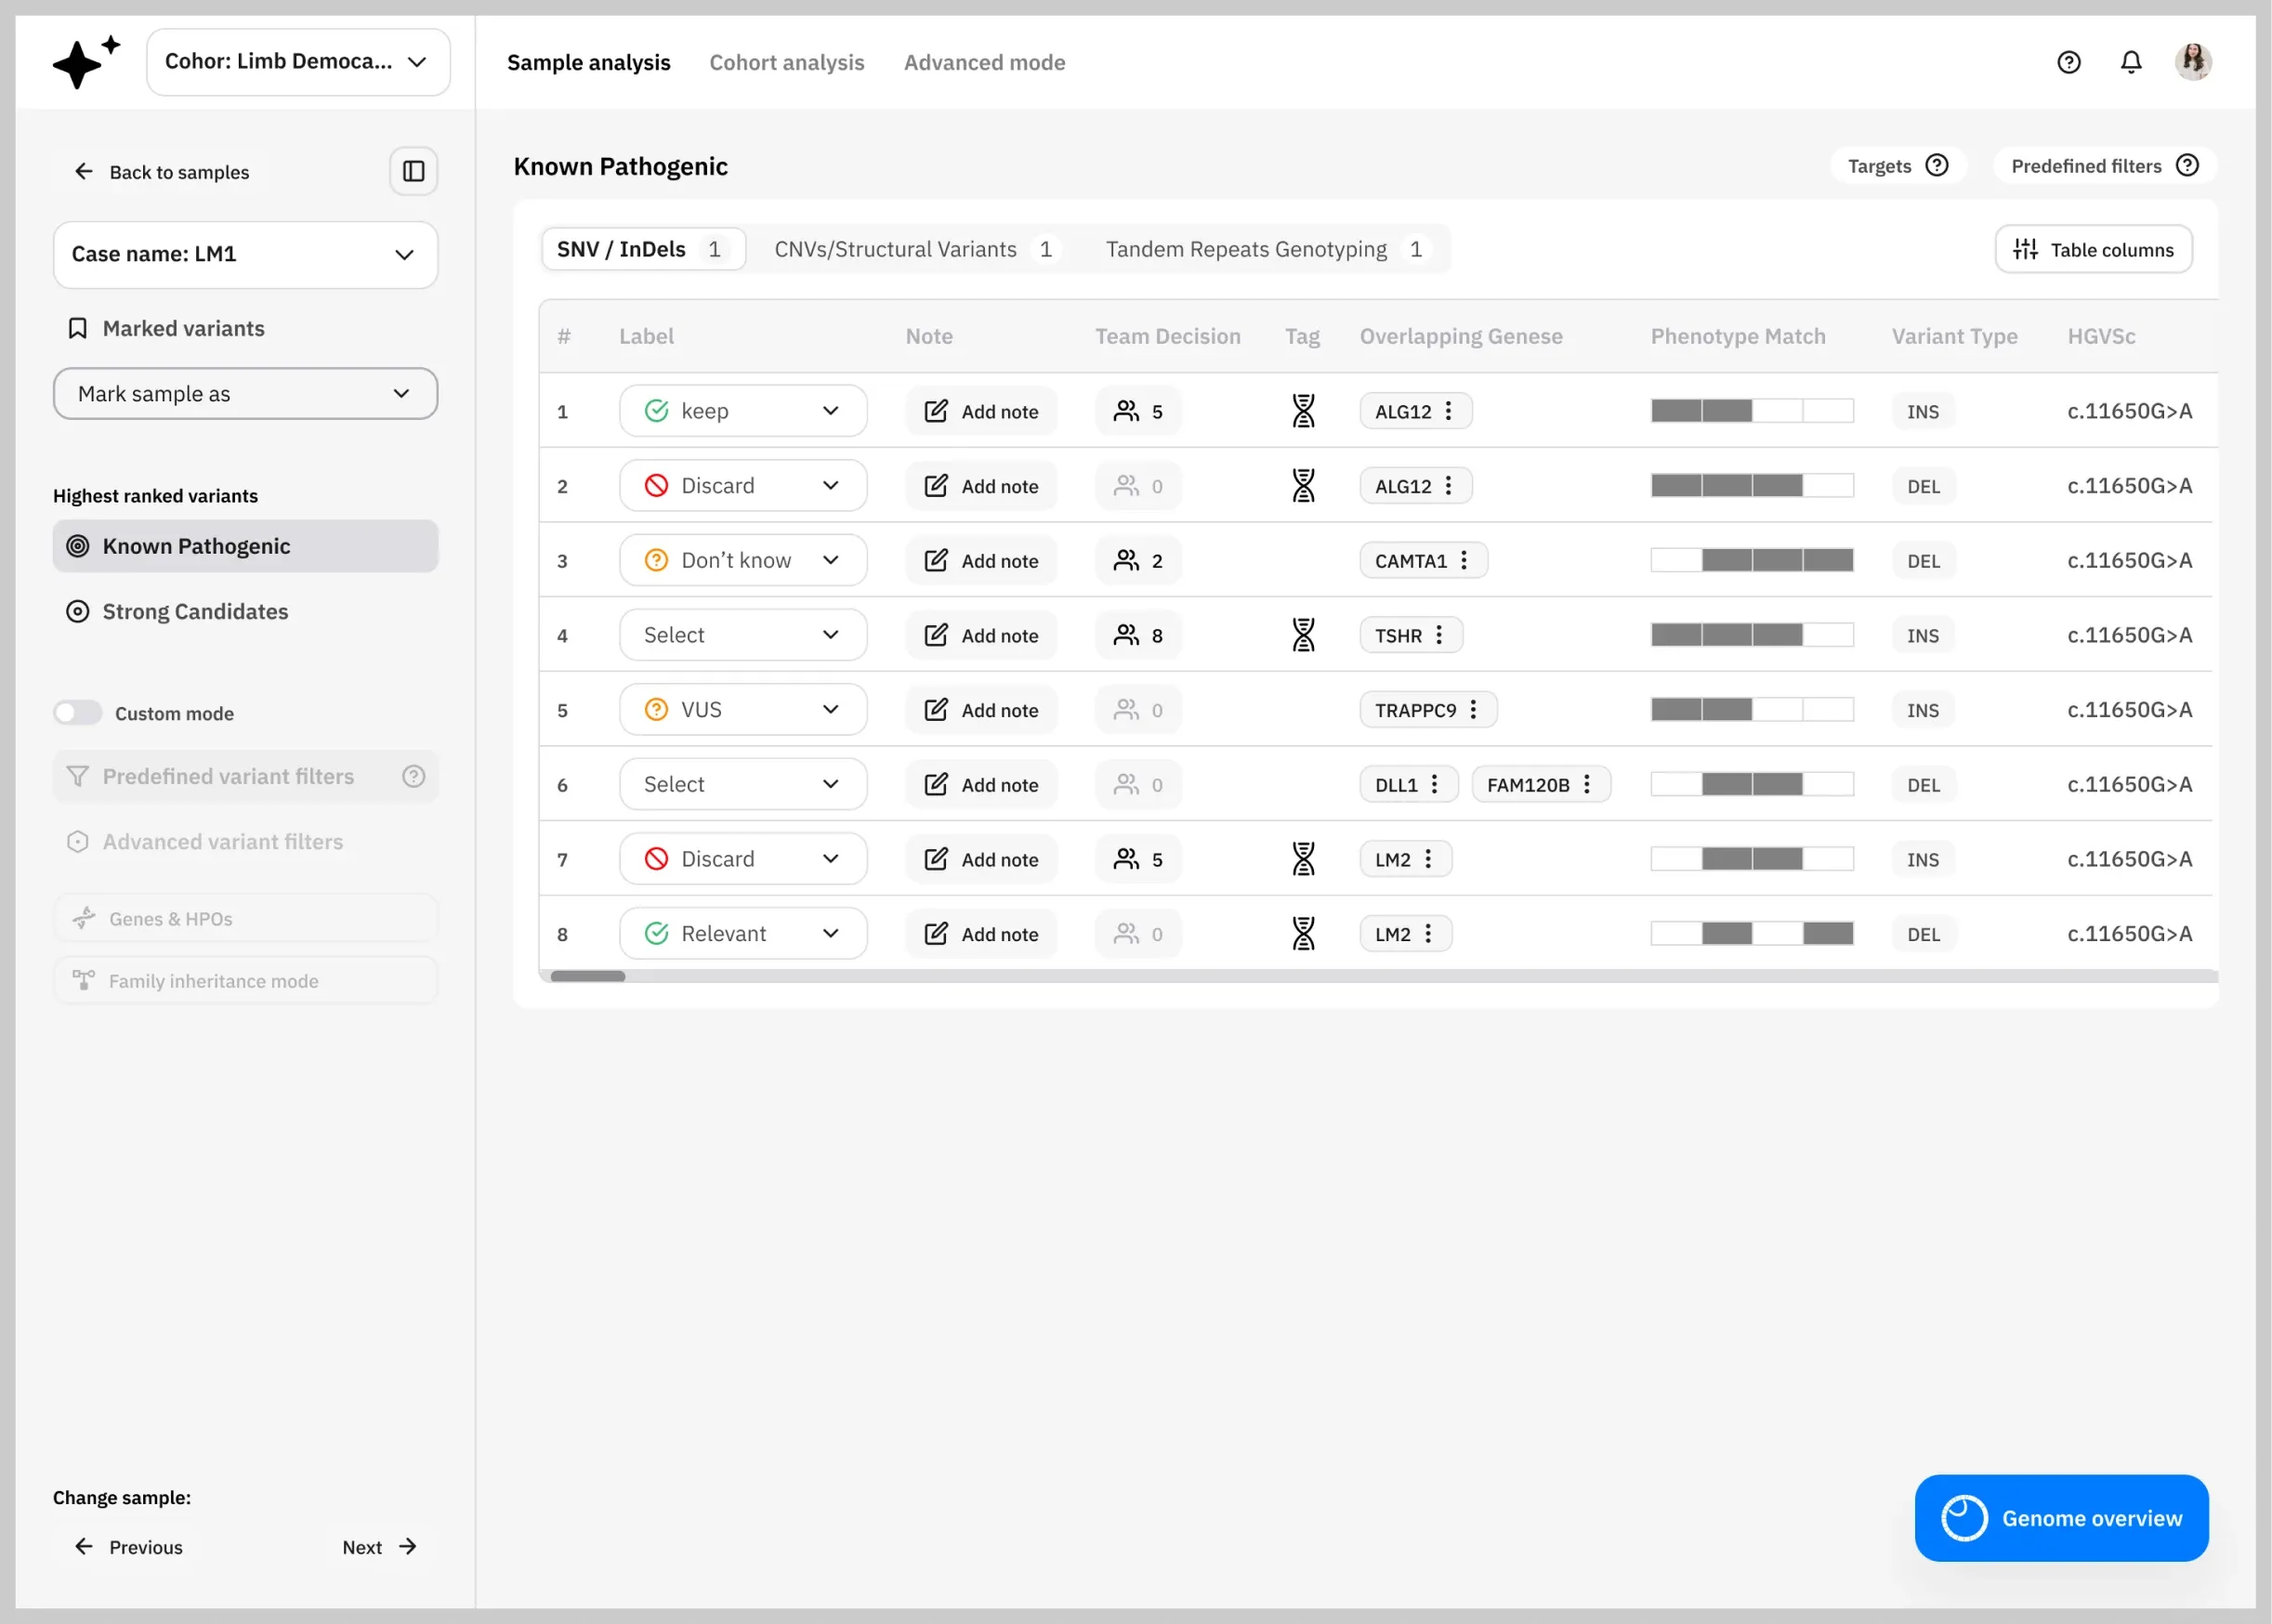
From a corporate look and feel, to a modern SaaS design system, matching the brand direction.
Lucid's front-end ran on an existing component library with a corporate look, and rewriting it was never the job: the goal was engagement and usability. So we rebuilt the design layer on top of it, tokens, modular components, templates and patterns, restyled to a modern SaaS standard with no significant change to the code base.
Blue
- HEX
- 007BFF
- RGB
- 0, 123, 255
Pure White
- HEX
- FFFFFF
- RGB
- 255, 255, 255
Gray
- HEX
- F1F1F1
- RGB
- 241, 241, 241
Pure Black
- HEX
- 000000
- RGB
- 0, 0, 0
One typeface, from screen titles to variant tables.
IBM Plex Sans carries the whole product: the names of screens, the dense data researchers and clinicians read, and every action they take.
Individual Analysis
ANK2 · c.11650G>A · AF1
View next sample
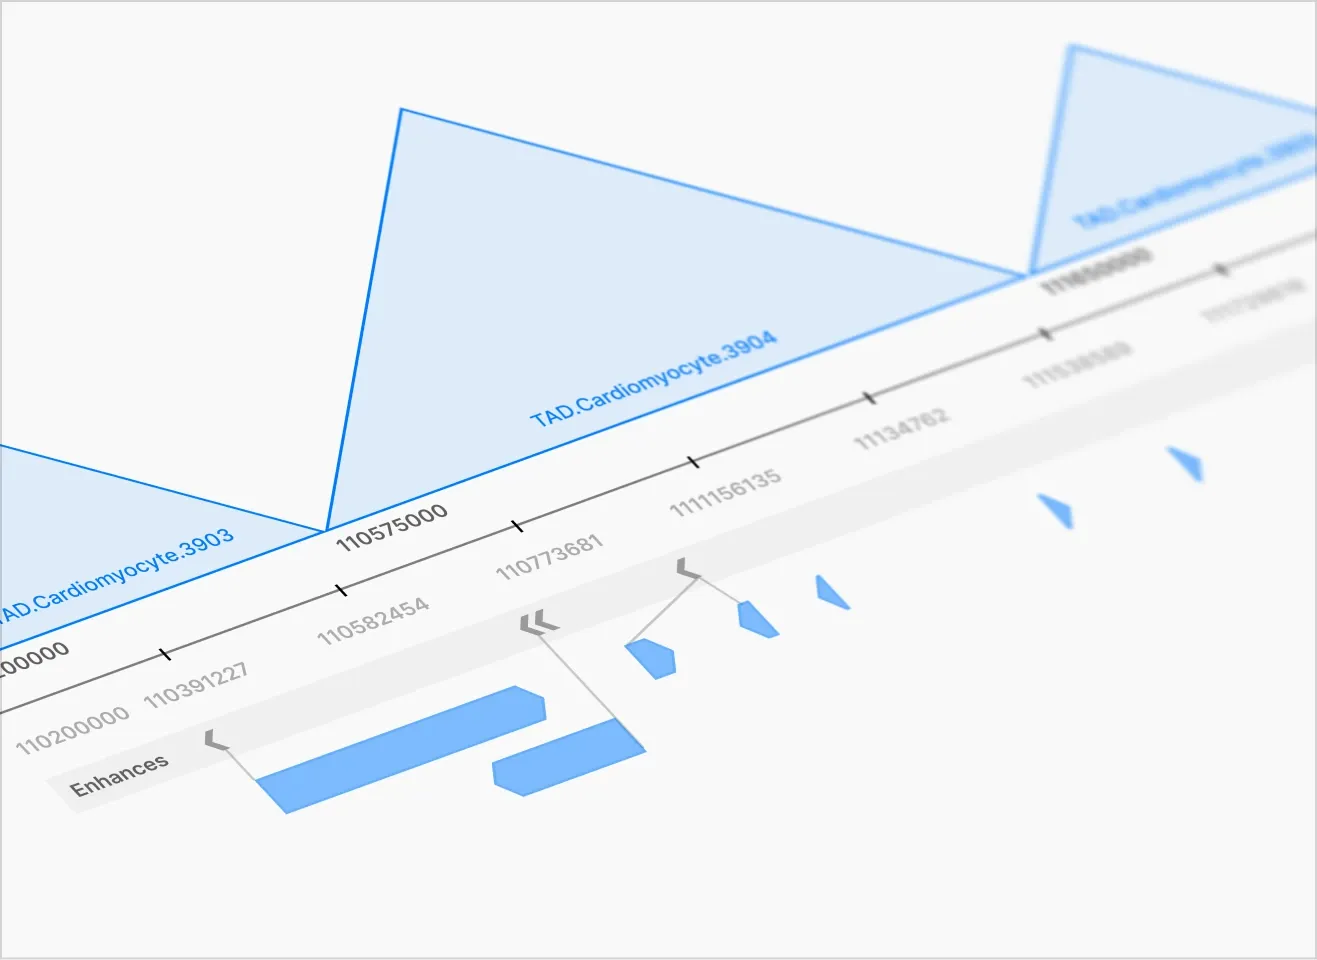
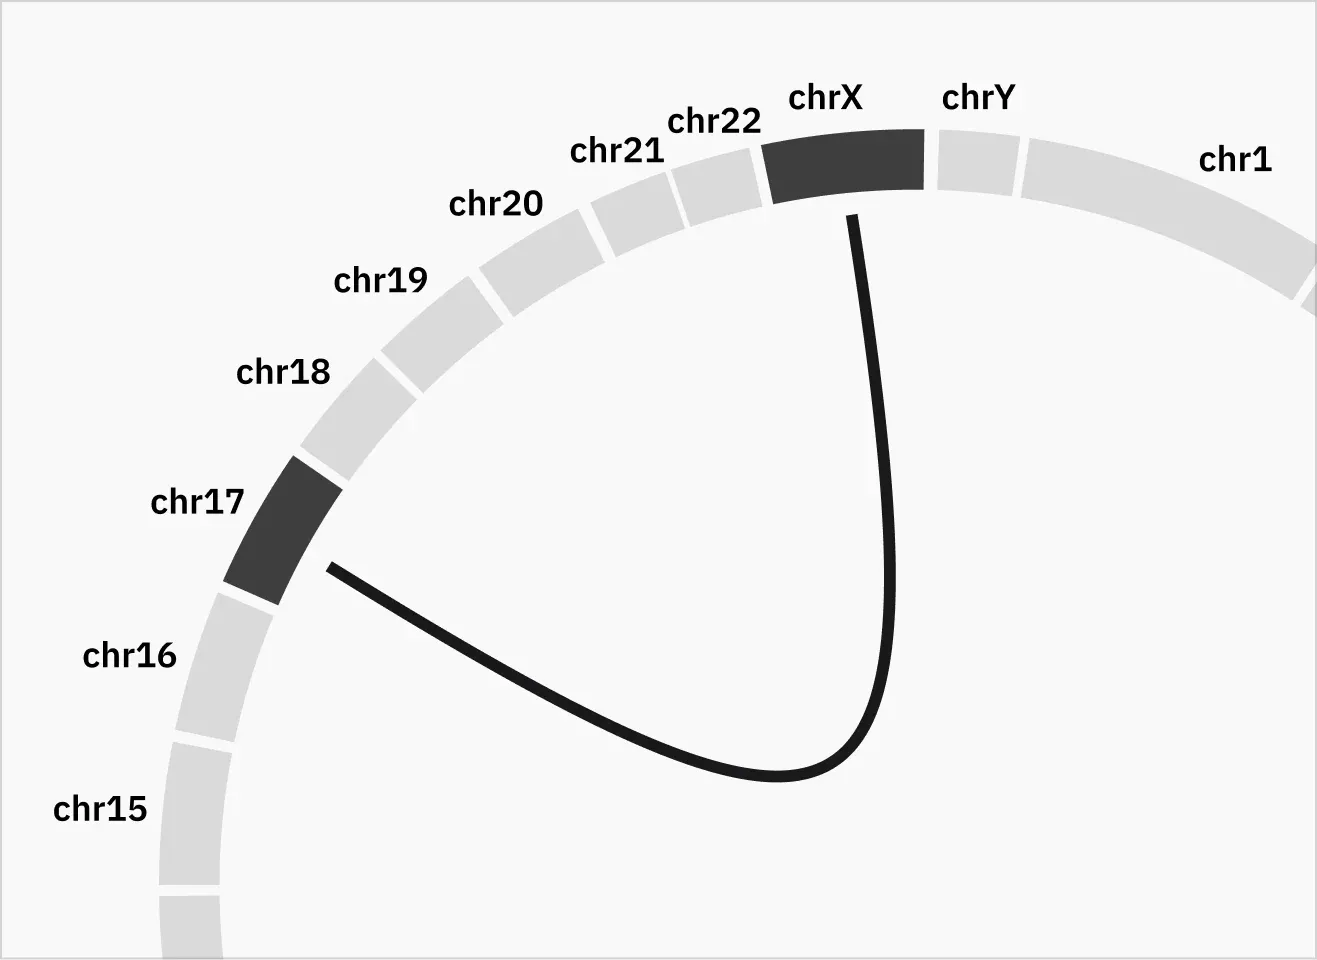
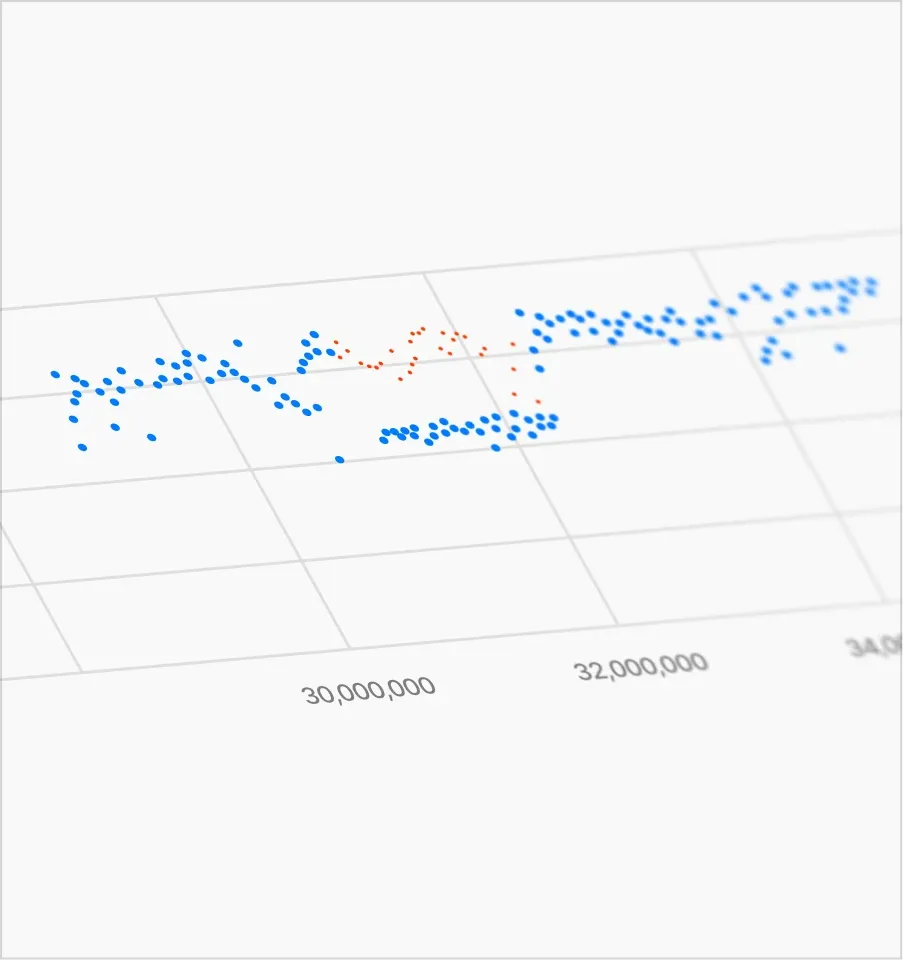
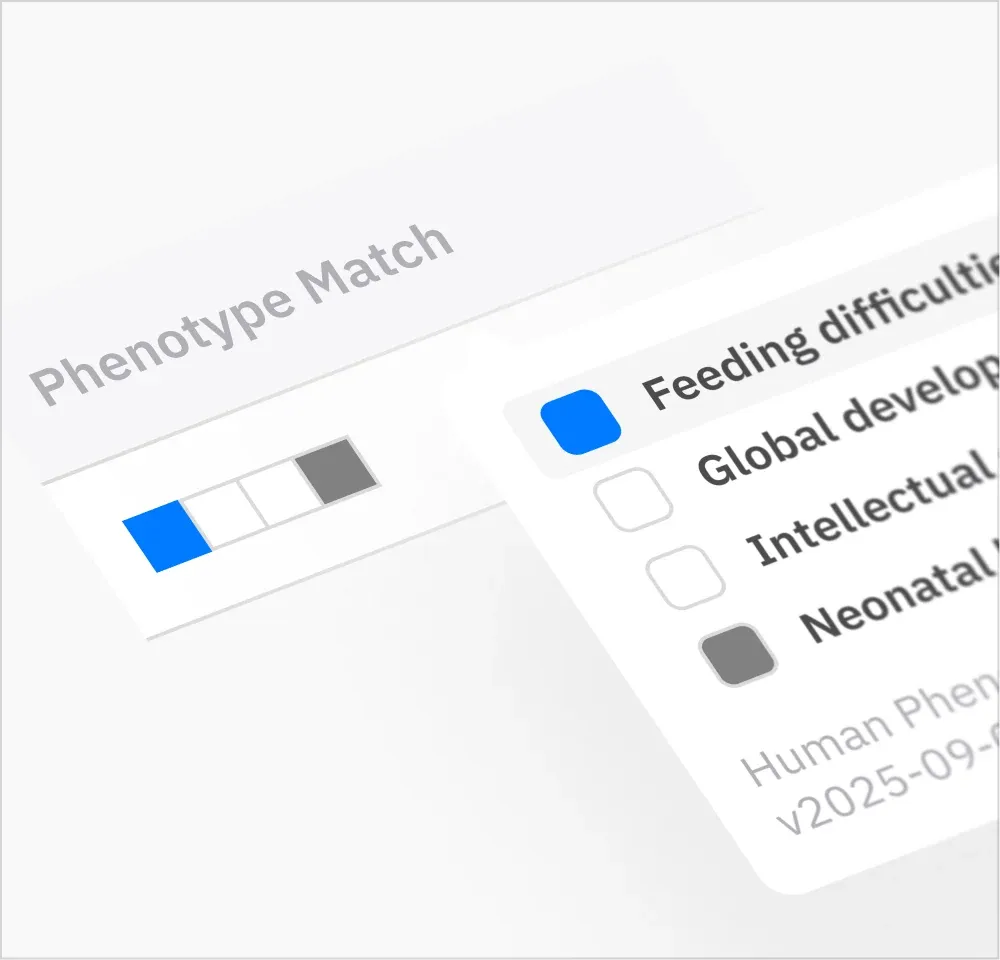
Built as infrastructure, so new screens compose from parts that already exist.
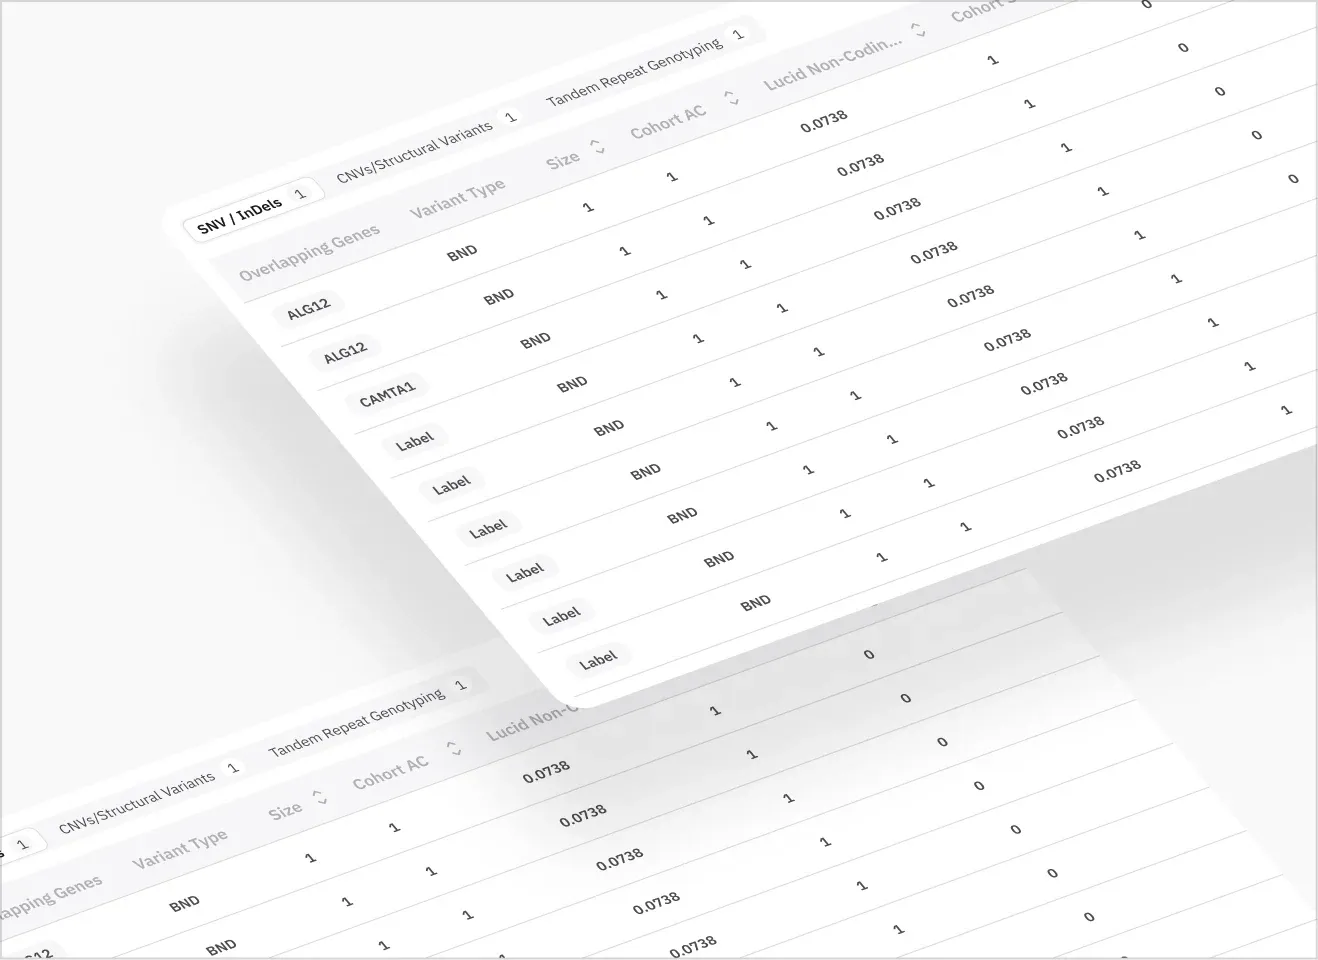
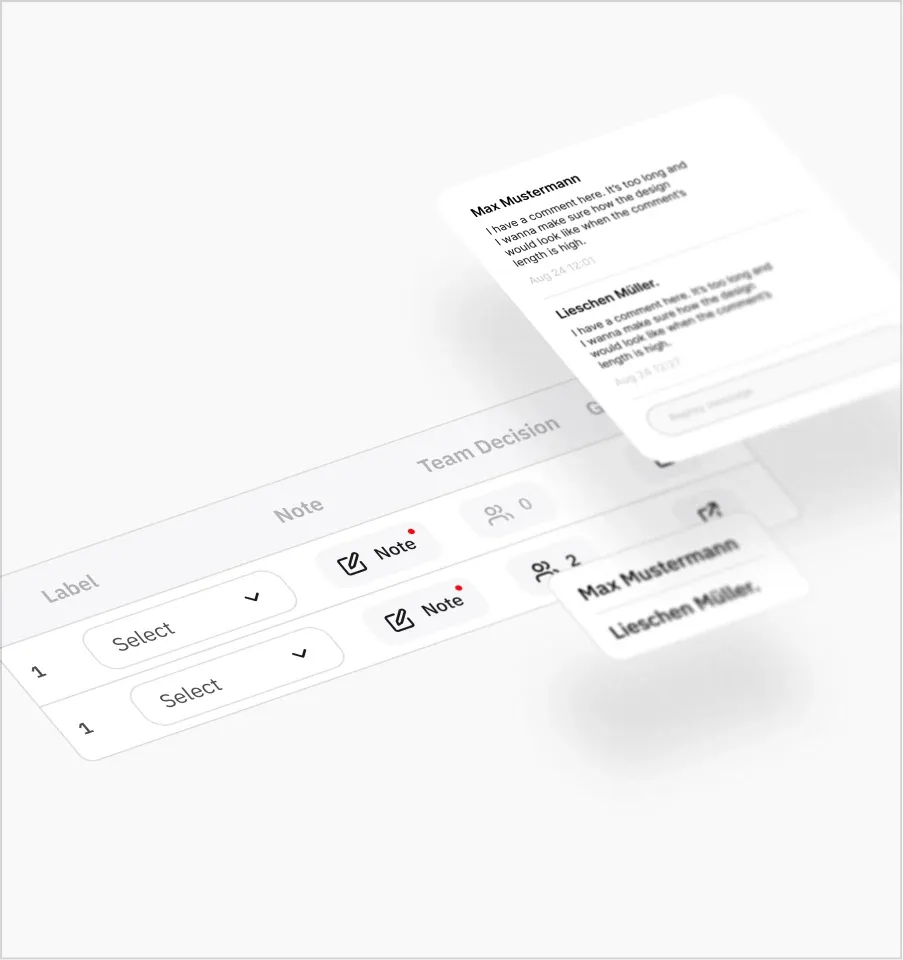
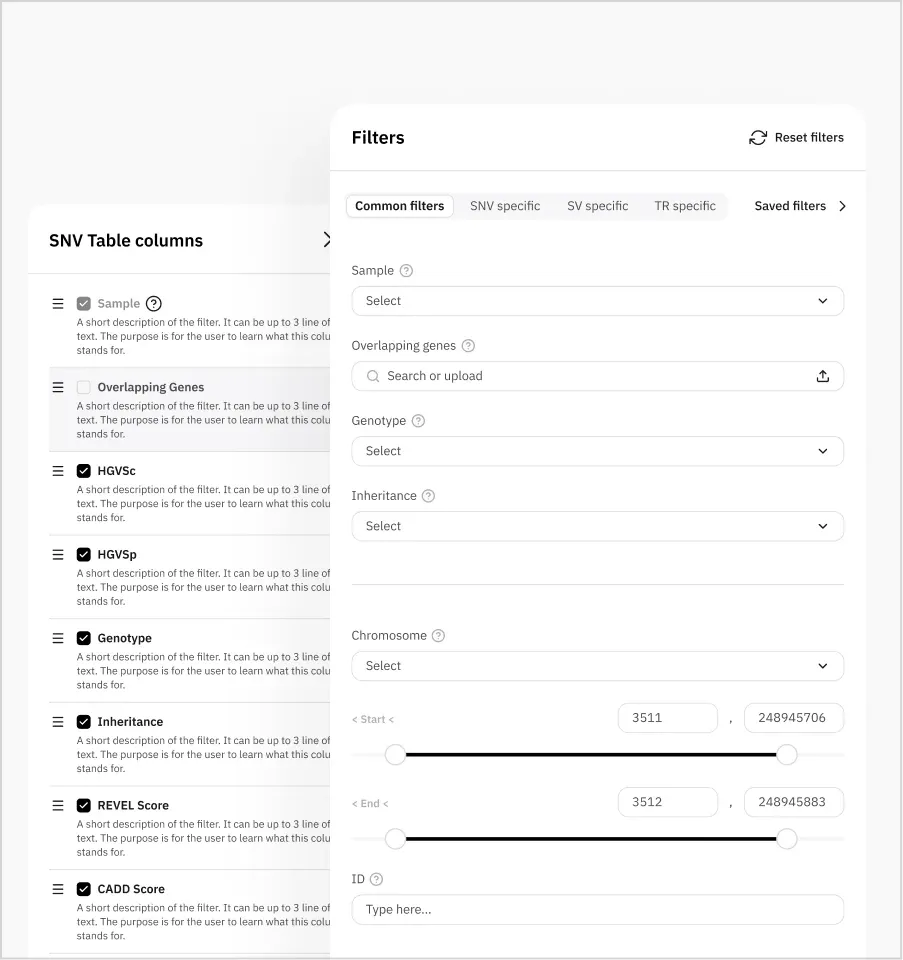
What changed.
Lucid ended with three things: a product organized around how its two user types actually work, a design system their own team builds with, and a discovery and delivery process with an owner at every stage.
≈2×
Faster delivery
Clarity moved up front: the team knew what to build, and feedback, sometimes usability testing, was done before dev.
A product organized around workflows
Every new request has a place in the structure, so the team knows where it sits before they build it.
A process the team owns
Inputs, ideation and ownership are defined at every stage, and the conversation moved from output to outcome.
A design system the team builds with
Screens ship without new design, and they ship faster. Product stakeholders prototype with it themselves.
Ready to raise?
Let's talk about your Series A timeline and what's holding back your investor conversations.